|
|
|
|
|
23 July 1999
|
|
Federation of Electoric Power Companies
|
|
|
|
Forecast of Electricity Demand
for this Summer
|
|
|
|
1. Forecasts of Peak Load & Supply during the
summer 1999(Gross Output across the 10 Companies)
|
|
|
|
Peak Load (A) mkW
|
176.64
|
|
Supply Capability (B) mkW
|
198.37
|
|
Marginal Supply Capability (C) =(B)-(A) mkW
|
21.73
|
|
Marginal Supply Capability Ratio (D)=(C)/(A) %
|
12.3
|
|
|
|
|
|
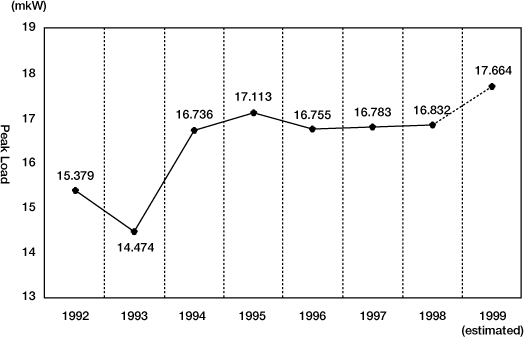
Results of Peak Load in recent Years(Gross Output across
the 10 Companies)
|
|
|
|
|
1992
|
1993
|
1994
|
1995
|
1996
|
1997
|
1998
|
|
Recorded Date
|
4 September
|
25 August
|
4 August
|
25 August
|
2 August
|
2 September
|
3 August
|
|
Peak Load(mkW)
|
153.79
|
144.74
|
167.36
|
171.13
|
167.55
|
167.83
|
168.32
|
|
Inrease compared to previous
year(mkW)
|
4.75
|
-9.05
|
22.62
|
3.77
|
-3.58
|
0.28
|
0.49
|
|
Increase rate(%)
|
3.2
|
-5.9
|
15.6
|
2.3
|
-2.1
|
0.2
|
0.3
|
|
|
|
|
|
Trend of Peak Load(Gross Output across the 10 companies)
|
|
|
|
|
|
|
|
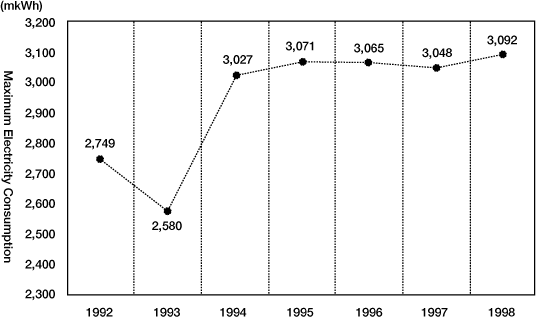
2. Results of Maximum Electricity Consumption in
recent Years(across the 10 Companies)
|
|
|
|
|
1992
|
1993
|
1994
|
1995
|
1996
|
1997
|
1998
|
|
Recorded Date
|
4 Septemb
|
25 August
|
4 August
|
25 August
|
2 August
|
2 Septemb
|
3 August
|
|
Peak Load(mkWh)
|
2,749.374
|
2,579.998
|
3,027.095
|
3,071.303
|
3,064.538
|
3,048.538
|
3,091.932
|
|
Inrease compared to previous
year(mkWh)
|
60.977
|
-169.376
|
447.097
|
44.208
|
-6.765
|
-16.166
|
43.560
|
|
Increase rate(%)
|
2.3
|
-6.2
|
17.3
|
1.5
|
-0.2
|
-0.5
|
1.4
|
|
|
|
|
|
Trend of Maximum Electricity Consumption(across the 10
companies)
|
|
|
|
|
|
|
|
3. Load Sensitivity to Temperature(weekdays in summer
season)
|
|
|
|
1998(across the ten
companies)
|
4.8mkW/C
|
|
|
(
|
"Load Sensibility to Temperature" explains
correlation between temperature and peak load, and
is volume of maximum power increased by every 1C.
|
)
|
|
|
|
|
|
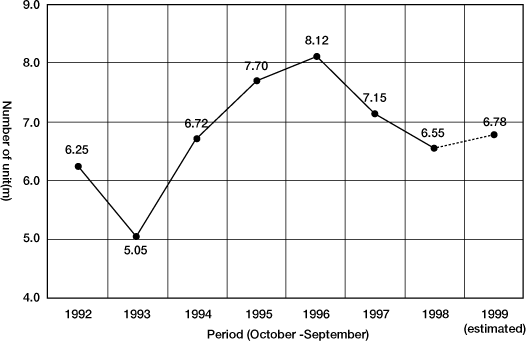
Trend of Shipment of Air Conditioners
|
|
|
|
|
|
|
|
4. Major New Power Plant Operations
Begun or will be operational from September 1998 to August
1999
|
|
|
|
Company
|
Power Plant
Name
|
unit
|
Output(mkW)
|
Start Month,
Year
|
|
Hydro Power
Plant
|
Hokkaido Electric Power
Company
|
Takisato
|
|
0.057
|
July 1999
|
|
Thermal Power
Plant
|
Tohoku Electric Power
Company
|
Higashiniigata
|
No.4-1
|
0.805
|
July 1999
|
|
Tokyo Electric Power
Company
|
Chiba
|
No.1-4
No.2-1
No.1-3
No.2-2
|
0.36
0.36
0.36
0.36
|
December 1998
February 1999
April 1999
July 1999
|
|
Chubu Electric Power
Company
|
Shinnagoya
|
No.7-2
No.7-3, No.7-4
No.7-5, No.7-6
|
0.243
0.243x2
0.243x2
|
October 1998
November 1998
December 1998
|
|
|
|
|
|
Individual Power Plant(IPP) Operations Begun in 1999
|
|
|
|
Recieving
Company
|
IPP Facility
Name
|
Output(mkW)
|
Start Month,
Year
|
|
Tokyo Electric Power
Company
|
EBARA Corporation
SHOWA DENKO K.K.
TOMEN POWER SAMUKAWA CORPORATION
Hitachi Zosen Corporation
|
0.064
0.1242
0.0655
0.1027
|
July 1999
July 1999
July 1999
July 1999
|
|
Kansai Electric Power
Company
|
NIPPON STEEL Corporation
Hirohata Works
NAKAYAMA KYODO HATSUDEN CO.,LTD.
KOBE STEEL KAKOGAWA WORKS
|
0.133
0.144
0.0545
|
April 1999
April 1999
April 1999
|
|
Kyushu Electric Power
Company
|
NIPPON STEEL
Corporation(Tobata)
KYUSHU OI�k CO.,LTD.
|
0.137
0.137
|
April 1999
April 1999
|
|
Total(figures of
Decommisioned plants are included)
|
3.954
|
|
|
|
|
|
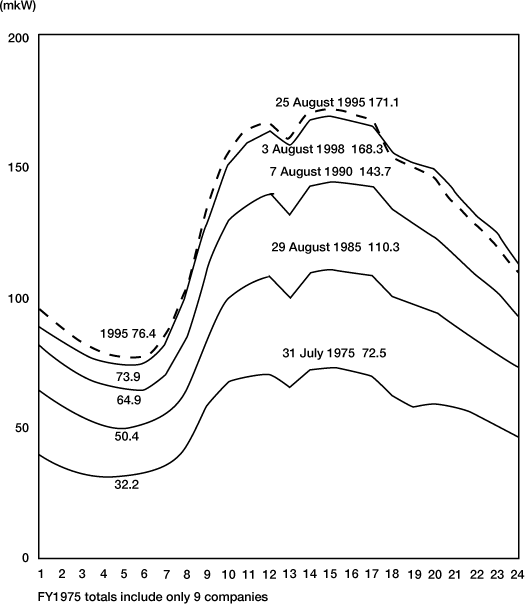
Appendix 1 : Trends in Daily Electricity Use (Daily
Load Curve, total across 10 companies)
|
|
|
|
|
|
|
|
Appendix 2 : Outline of Efforts to
Introduce Demand Side Management
|
|
|
|
(1)Supply and Demand Adjustment Contract
|
|
|
A discount system for electricity rates that
applies discounts in proportion to the amount of
electricity used. In return for reducing their
power consumption during certain specified periods,
customers are granted reduced electricity rates.
Options include the Annual Adjustment Contract,
which shifts load from the daytime to nighttime on
weekdays, holidays, and the like throughout the
year, and the Planned Adjustment Contract, which
reduces load during the period forecast to have the
hottest weather.
|
|
|
|
|
(1)Changes in Load Resulting from
Supply and Demand Adjustment Contract
Implementation (Total of 10 Companies)
|
|
|
(mkW)
|
|
|
FY
1992
|
FY
1993
|
FY
1994
|
FY
1995
|
FY
1996
|
FY
1997
|
FY
1998
|
FY
1999
|
|
Annual Adjustment
Contract
|
3.12
|
3.09
|
3.08
|
3.01
|
3.17
|
3.40
|
3.60
|
3.49
|
|
Planned Adjustment
Contract
|
2.74
|
3.10
|
3.56
|
3.41
|
3.32
|
3.48
|
4.42
|
4.82
|
|
Thermal Storage
Adjustment Contract
|
0.56
|
0.62
|
0.64
|
0.76
|
0.84
|
0.93
|
1.04
|
1.20
|
|
Total
|
6.41
|
6.80
|
7.28
|
7.18
|
7.32
|
7.80
|
9.06
|
9.50
|
*Notes: Because of rounding, grand
totals do not necessarily correspond with the
totals for each type of contract.
|
|
|
|
|
(2)Ice Thermal Storage Type Air-Conditioning
System(Eco Ice)
|
|
|
Customers can take advantage of lower nighttime
electricity rates to store thermal energy at night,
and use that energy to cool their buildings during
the day. As a result, customers can benefit from
reduced electricity rates.
(Reduced load by introducing Eco Ice in this summer
will be approx. 0.25mkW which is included in the
1999 figure of Thermal Storage Adjustment Contract)
|
|
|
|
|
(2) Ice Thermal Storage Type
Air-Conditioning System Installations
(Total of 10 Companies)
|
|
|
(unit)
|
|
|
Number recorded
at the end of FY
|
|
1992
|
1993
|
1994
|
1995
|
1996
|
1997
|
1998
|
1999
|
|
Decentralized
Type
|
63
|
93
|
122
|
204
|
587
|
1,306
|
2,753
|
2,968
|
|
Centralized
Type
|
370
|
485
|
576
|
669
|
822
|
1,002
|
1,195
|
1,223
|
|
Total
|
433
|
578
|
698
|
873
|
1,409
|
2,308
|
3,948
|
4,191
|
*Figures for FY1999 are based on
bulletin figures from January to April
|
|
|
|
|
(3) Eco-Venders
|
|
|
An energy-saving vending machine for beverages
that was developed jointly by Tokyo Electric Power
Company, Fuji Electric Company and Coca-Cola Japan
Company Ltd. in 1995. Compared with conventional
vending machines, Eco-Venders are equipped with
improved insulation, and can cool beverages
thoroughly during the morning hours, and then cut
their power consumption by about 90% on summer
afternoons, when electricity demand is at its
highest.
(Reduced load by introducing Eco-Vender in this
summer will be approx. 0.34mkW)
|
|
|
|
|
Eco-Vender Installations(Total of 10
Companies)
|
(unit)
|
|
|
end of FY
1995
|
end of FY
1996
|
end of FY
1997
|
end of FY
1998
|
May FY
1999*
|
|
Number of
unit
|
578
|
35,440
|
288,224
|
614,742
|
682,430
|
|
*Figures for 1999 are
based on bulletin figures from January to
the end of May 1999
|
|
|
|
|
|