|
|
|
|
|
September 10 1999
|
|
|
|
Summer 1999 Electric Power
Supply
|
|
|
|
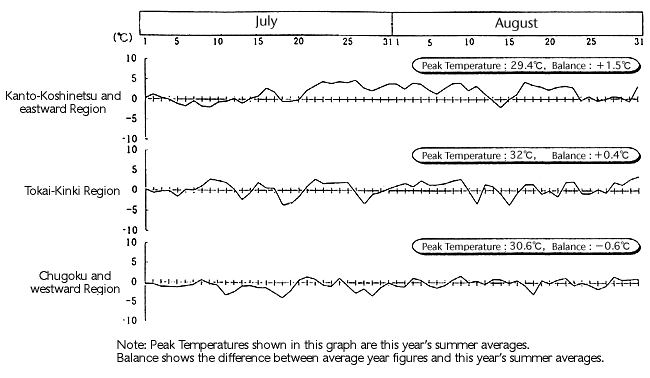
1. Summer Peak Temperature Trends (average ,
July-August)
|
|
|
|
|
|
|
|
<Appendix>
|
|
|
Number of Full Summer Days and Balance between
Average Year and this Summer
|
Sapporo
|
Sendai
|
Tokyo
|
Nagoya
|
Toyama
|
Osaka
|
Hiroshima
|
Takamatsu
|
Fukuoka
|
Naha
|
Average of 10
Cities
|
No. of
Full Summer Days
(Balance)
|
15
(7.9)
|
25
(9.9)
|
45
(9.1)
|
45
(1.8)
|
31
(0.2)
|
51
(1.4)
|
39
(-7.3)
|
42
(-1.9)
|
33
(-11.1)
|
50
(-0.2)
|
38
(1.0)
|
|
Note: Balance shows average
number in July and August in an average year
|
|
|
|
|
|
2. Peak Load and Daily Peak Load Record for this
Summer
|
|
|
|
Company
|
Peak Load
|
Best Record
(date)
|
Ratio
|
|
Daily Peak
Load
|
Best Record
|
Ratio (compared to last
year)
|
|
Hokkaido
|
|
451
(1997/7/25)
|
105.1
|
|
|
89
(1997/7/31)
|
105.4
(107.5)
|
|
Tohoku
|
|
1,359
(1998/7/28)
|
106.2
|
|
|
250
(1998/7/28)
|
107.2
(107.2)
|
|
Tokyo
|
|
5,940
(1996/7/18)
|
99.7
|
|
|
1,078
(1996/7/18)
|
99.2
(99.8)
|
|
Chubu
|
|
2,639
(1998/8/4)
|
97.8
|
|
|
472
(1998/8/4)
|
98.4
(98.4)
|
|
Hokuriku
|
|
523
(1997/8/22)
|
101.0
|
|
|
94
(1997/8/22)
|
102.8
(109.1)
|
|
Kansai
|
|
3,223
(1996/8/2)
|
95.3
|
|
|
579
(1998/8/4)
|
96.2
(96.2)
|
|
Chugoku
|
|
1,127
(1996/8/2)
|
94.7
|
|
|
204
(1998/8/4)
|
96.2
(96.2)
|
|
Shikoku
|
|
580
(1998/8/7)
|
90.4
|
|
|
106
(1998/8/7)
|
90.0
(90.0)
|
|
Kyushu
|
|
1,612
(1998/8/6)
|
90.4
|
|
|
299
(1998/8/7)
|
90.5
(90.5)
|
|
Okinawa
|
|
141
(1998/7/15)
|
98.3
|
|
|
29
(1998/8/21)
|
97.6
(97.6)
|
|
10
Companies
|
|
17,113
(1995/8/25)
|
98.6
|
|
|
3,092
(1998/8/4)
|
100.2
|
|
Note: 1.
|
* indicates newly established
record
# indicates renewed summer record
[ ] indicates the number of renewed
records
|
|
2.
|
Temperatures shown in Peak load
section are for cities where each electric power
company's head office is located
|
|
3.
|
Peak Load and Daily Peak Load
figures are based on bulletin figures (small outer
islands excluded)
|
|
|
|
|
|
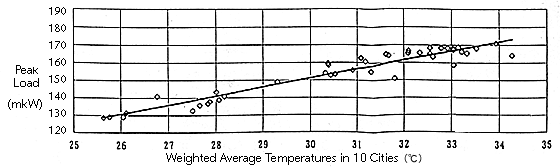
3. Load Sensitivity to Temperatures this Summer
|
|
|
Total of Load Sensitivity to Temperatures across the 10
power companies (based on weekday data for July and August;
estimated at 4.9mkW/C (an increase of approx. 0.1mkW/C over
the previous year)
|
|
|
Correlation Ratio between Peak load and
Temperature
|